Web Interface
This section guides you through the process of using Workflomics, from accessing the platform to generating and benchmarking workflows. Workflomics offers an intuitive web interface that enables users to efficiently create, compare, and optimize computational workflows for bioinformatics research.
Accessing Workflomics
To begin exploring the capabilities of Workflomics, you can deploy your own instance of Workflomics (see the instructions) or visit the demo:
Live Demo: Workflomics Live Demo
Note
The live demo is temporarily hosted on a server that does not have an SSL certificate. Consequently, your browser may display a security warning. Please note that the platform does not retain any user data, so you can safely disregard this warning.
How to Use Workflomics
Generating and benchmarking workflows with Workflomics involves several key steps, each designed to ensure that the workflows you create are optimally configured for your specific data analysis requirements.
Explore Workflows
The first step in generating and benchmarking workflows is choose “Explore” from the home menu. This will take you to the workflow generation interface, where you can specify the domain of your research and the desired inputs and outputs.

Home page of the Workflomics web interface.
The “Explore” option allows you to specify the domain of your research and the desired inputs and outputs.
Choose the Domain
The first step in generating workflows is to select the domain of your research. The Workflomics instance on workflomics.org currently only implements the proteomics domain as an example. By specifying the domain, you focus the workflow generation process on the most relevant tools and methods for your research area.

Web interface for choosing the domain of your research. Workflomics currently supports only the proteomics domain.
Choose Workflow Inputs and Outputs
Before generating workflows, you must specify the desired inputs and outputs. This initial step is crucial as it defines the scope and objectives of the computational task. Each input and output is defined as a pair of data type and format, using EDAM Ontology terms (see EDAM Ontology). The data types and formats provided in workflomics are tailored to the proteomics domain and the available tools, therefore, the user can only select types and formats that are supported by the tools in the proteomics domain.

Web interface for specifying the available workflow inputs and desired workflow outputs.
To load the example inputs and outputs, click on the “Load Example” button. The goal of this example is to create workflows designed to detect overrepresented biochemical pathways, molecular functions, and cellular components from mass spectrometry data on proteins or their digested peptides, as defined in the gene ontology (GO). To do this, you need two types of files: a mass spectrometry data file in the HUPO-PSI standard mzML format and a FASTA format file that includes protein sequences. The FASTA file not only provides the amino acid sequences for matching to mass spectra but also includes gene and protein names necessary for fetching GO annotations. The goal is to produce over-representation data in a structured text format, such as JSON.
Based on the problem description, the inputs specified are Mass spectrum in mzML format, and Protein sequence in FASTA format, while the output is Over-representation data in a JSON format.
Specify Constraints
Constraints enable you to refine your workflow search by setting specific requirements, such as including or excluding certain tools or operations from a drop-down menu. Here, a “tool” refers to a specific software tool, often a single command on a command line. An “operation,” on the other hand, refers to an EDAM operation, which is a more abstract concept that can be implemented by various tools and have defined relationships with other operations within a hierarchical structure (e.g. Tag-based peptide identification is a Peptide identification). This allow you to require specific functionality of the generated workflows without explicitly mentioning particular tools.

Web interface for specifying constraints on the workflow generation process.
In our example, we require the workflow generator to include a Peptide identification operation, as a crucial step in the targeted workflows. Additionally, we exclude the use of Protein quantification as we use label-free data, which can be analyzed by most proteomics software.
Specify Search Parameters
Adjusting search parameters enables you to fine-tune the workflow generation process, influencing how Workflomics explores the vast space of possible workflows.

Web interface for specifying search parameters for the workflow generation process.
The parameters influence how Workflomics explores the range of possible workflows. These parameters include the maximum number of steps (tools) in the workflow, the runtime of the generation algorithm, and the number of workflows to generate.
Explore Generated Workflows
Once you have specified the domain, inputs, outputs, constraints, and search parameters, Workflomics will generate a list of candidate workflows that meet your criteria. You can then explore these workflows to identify the most promising options for your research.
Workflow structure

Web interface for exploring the candidate workflows generated by Workflomics.
Each workflow is presented as a directed acyclic graph (DAG) that visualizes the sequence of operations and tools involved, rectangles represent the tools and the arrows represent the data flow between them. You can click on each workflow and download it in SVG format, or as a CWL (Common Workflow Language, a standard for describing computational data-analysis workflows) file for further evaluation and execution.
Design-time benchmarks
In addition to visualizing the workflows, a design-time analysis of each workflow is also provided. This analysis includes the number of steps, and quality metrics for each tool, such as the number of citations, license openness, and OS compatibility.

Web interface for visualising design-time benchmarks of the candidate workflows.
Each workflow contains a design-time benchmarks that provide information about the quality of the tools used in the workflow. The design-time benchmarks are obtained from the bio.tools and OpenEBench APIs, and include the following:
OS Compatibility: Understanding tool compatibility with different operating systems (Linux, macOS, MS Windows) is crucial for users who require their pipelines to run directly on designated machines with accessible tools. While containerized environments can mitigate compatibility issues, direct compatibility remains essential for certain scenarios due to performance or specific use-case requirements. The OS compatibility, obtained from bio.tools, is provided on the tool level and aggregated by the count of tools that support each operating system.
License: The openness of the software license is a crucial factor in selecting tools for workflows. Open-source tools are generally preferred due to their transparency, allowing users to inspect and verify code for security and integrity, customizability, and community support. Licenses can be OSI-approved, open, closed, or unknown. License information, provided on the tool level and aggregated by the count of open licenses, is sourced from OpenEBench.
Citations: The number of citations for software is a potential indicator of the tool’s reliability and community support. While the number of citations alone does not guarantee quality, especially in rapidly evolving fields where newer tools may not have accumulated as many citations as older ones, tools with a higher number of citations are often considered more reliable and widely used. The number of citations, obtained from OpenEBench, is presented at the tool level and as the median per workflow. The median is used to account for outliers and provide a more representative measure of citations across the workflow. More sophisticated metrics, such as tool co-citations, are part of ongoing work.
Note
You can toggle between the visual representation of the workflow and the design-time benchmarks by clicking the toggle button at the top left of the interface.
Pick Candidate Workflows and Run Them Locally
After Workflomics has generated a list of candidate workflows, the next step is to evaluate these workflows to determine which ones best meet your research objectives. This involves selecting promising workflows based on the criteria you have set and running them on your local machine.
Selecting Workflows: Review the list of candidate workflows generated by Workflomics. Consider factors such as the OS support, license, citations, and the overall workflow complexity. Select the workflows (workflows can be marked on the left hand side of the interface by clicking on the checkbox) that align with your objectives and click on “Download selected” to download locally the files in CWL format. Your browser might ask you to confirm the download, as the CWL files are downloaded in a zip file.
Running Locally: Execute the selected workflows locally to test their performance. This hands-on evaluation is crucial for understanding how the workflow operates with real data and identifying any necessary adjustments.
For detailed instructions on how to benchmark workflows locally, including setting up your environment and running the benchmarking tool, please refer to the dedicated Benchmarker Guide in our documentation.
This step is essential for ensuring that the workflows you choose are not only theoretically sound but also practically viable for your research projects.
Upload Benchmark Results
After executing and analyzing the workflows, uploading the benchmark results to Workflomics facilitates the comparison of different workflows and enables you to visualize their performance metrics. This step is crucial for identifying the most efficient and reliable workflows for your research objectives.
Steps for Uploading Benchmark Results
Navigate to the Upload Interface: Access the Workflomics upload page dedicated to benchmark results at Workflomics Benchmarks Upload. This page was also accessible from the previous interface (Exploring Generated Workflows) by clicking on the “Upload benchmarked workflows” button. In addition, it is accessible from the home page by selecting the “Visualize benchmarks” option from the menu.
Prepare Your Benchmark Data: Ensure your benchmarks.json file is ready for upload (see How to generate benchmarks.json? if you still haven’t). This file should contain all relevant data from your benchmarking process.
Upload and Visualize: Follow the on-screen instructions to upload your benchmark results. Upon successful upload, you will gain access to Workflomics’ advanced visualization tools, enabling you to analyze and interpret your data.

Visualisation of the uploaded benchmarks
Upon successful upload, you will gain access to Workflomics’ tablular visualization of the benchmark results, enabling you to compare the performance of different workflows.
Analyzing Benchmark Results
Each workflow benchmark result is presented as a row in the table, with columns representing individual benchmarks. The workflows can be further expanded to reveal detailed information about the tools and operations involved.
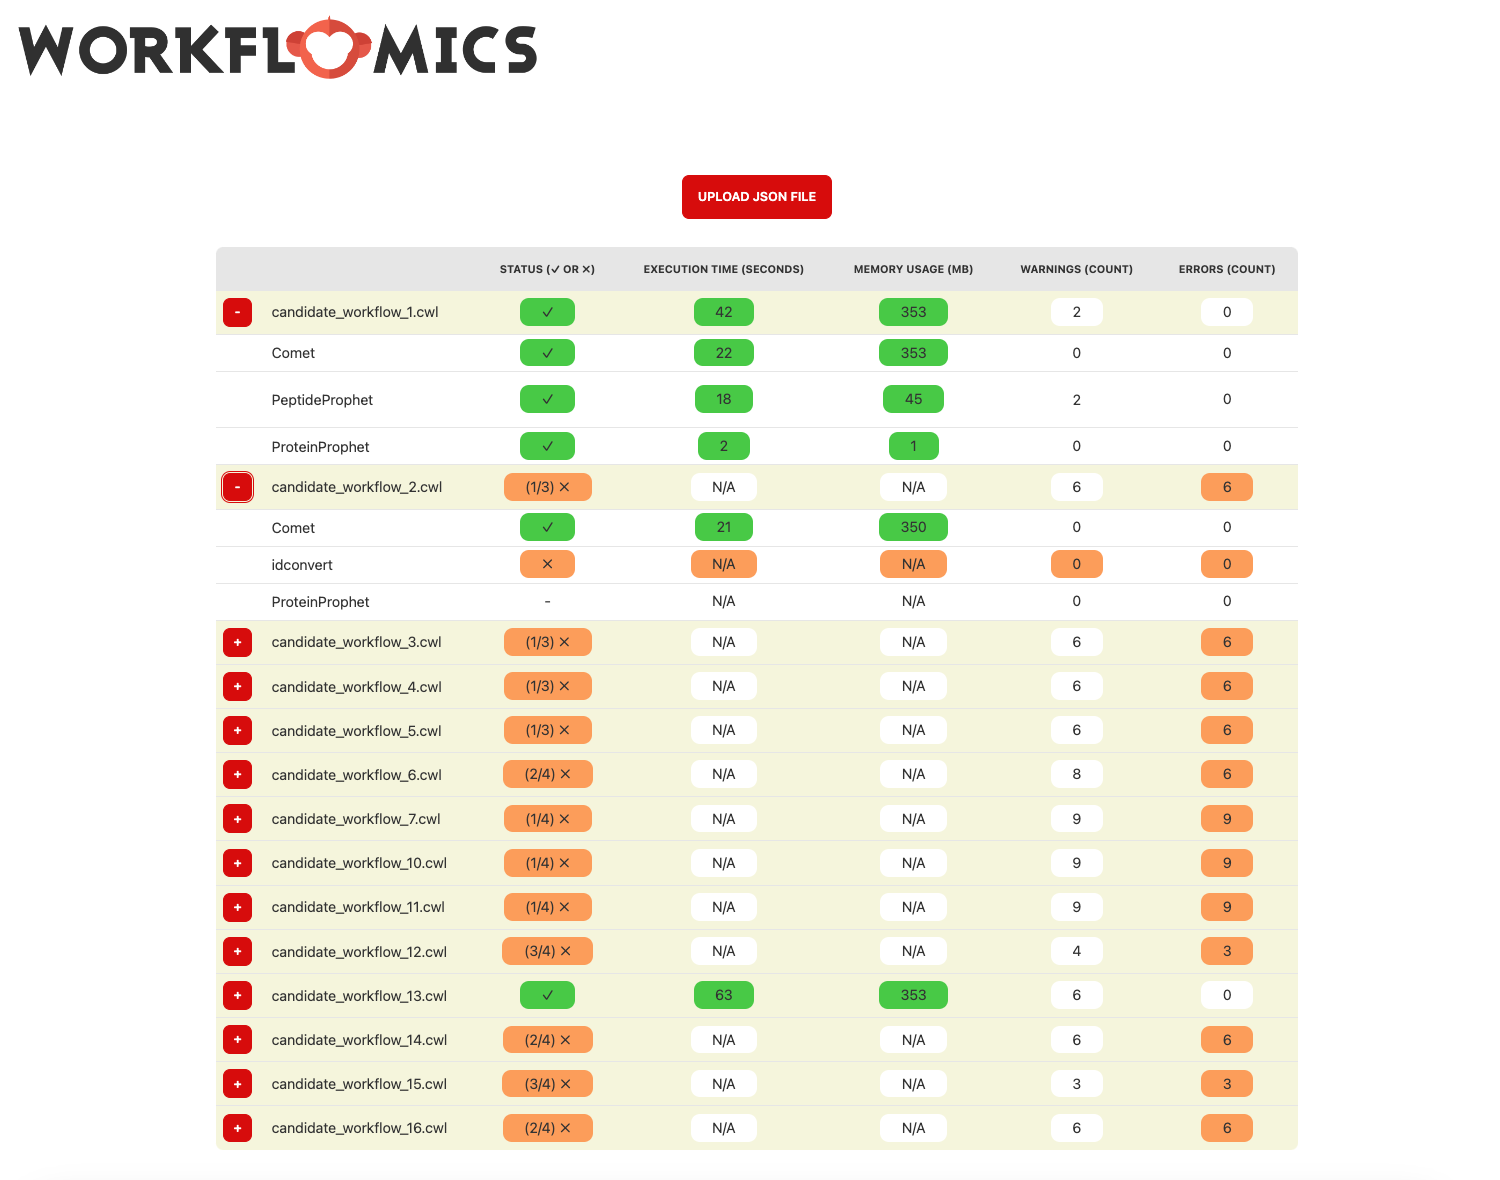
Expanded visualisation of the uploaded benchmarks
The workflows can be further expanded to reveal detailed information about the tools and operations involved. In the example, candidate workflows 1 and 2 are expanded to show the information about each tool and operation involved in the workflow. We can see that all the tools in the first workflow are executed successfully, while the second workflow has failed to execute the second tool “idconvert”.
The benchmark results are divided into two categories: Run-time benchmarks and Scientific benchmarks.
Run-time benchmarks
The run-time benchmarks are computed for each workflow and include the following metrics:
Execution Status: The execution status of the workflow indicates whether the workflow was successfully executed or encountered errors. This information is crucial for users to determine whether the tools comprising the workflow are compatible and functional. The execution status is provided at both the tool and workflow levels, with the workflow level aggregating the execution status of all tools in the workflow.
Execution Time: The execution time of the workflow indicates the time taken to complete the workflow execution. This information reflects the efficiency and performance of the workflows. The execution time is provided at both the tool and workflow levels, with the workflow level aggregating the execution time of all tools in the workflow.
Memory Consumption: The RAM consumption per tool indicates the amount of memory used by each tool during workflow execution. This information reflects the resource requirements of the workflows. The memory consumption is provided at both the tool and workflow levels, with the workflow level aggregating the memory consumption of all tools in the workflow.
Errors: The number of errors encountered during workflow execution indicates the reliability and stability of the workflows. The number of errors, and their content, are provided at both the tool and workflow levels, with the workflow level aggregating the number of errors encountered by all tools in the workflow.
Warnings: The number of warnings encountered during workflow execution indicates potential issues or inefficiencies in the workflows. The number of warnings, and their content, are provided at both the tool and workflow levels, with the workflow level aggregating the number of warnings encountered by all tools in the workflow.
Scientific benchmarks
The scientific benchmarks are domain- and operation-specific. For instance, in workflows involving protein identification, we provide benchmarks such as the number of proteins identified (see column Proteins). Similarly, for workflows that perform enrichment analysis, we measure the number of GO terms identified (see column GO-Terms). Unlike run-time benchmarks, scientific benchmarks are tailored to specific tools and their unique functions within the workflow. The provided figures do not include scientific benchmarks, however, they are available in the live demo.